

A Hundred and One Dollars
What your tank really costs, what the Fox graphic left out, and why $4 gas feels like the end of the world when the math says otherwise.
I believe most of you are going to be irritated by this story. Trust me. That is not my objective. But as I watched my credit card statement ratchet up as I filled my vehicle with regular unleaded gasoline, I kept wondering what the cost of this tank of gas in dollars from 2000 is, or 2010, or even 2020. That’s when I started digging in and decided to tell the story on-air this morning. This article is adapted from that on-air essay.
Read at your own risk.
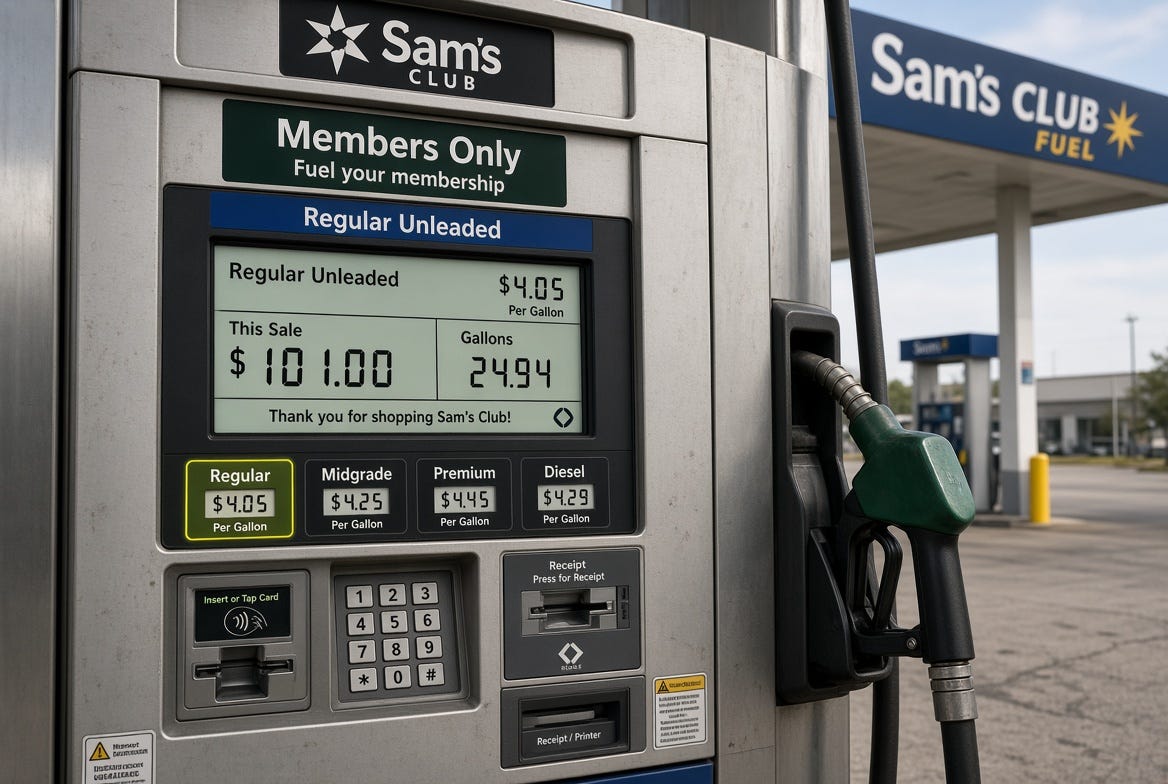
I coasted into Sam’s Club in my 2021 Jeep Grand Cherokee, running on fumes because I’d been putting it off all week.
Regular was $4.05 a gallon. I slid the card, picked up the nozzle, and did what every one of you does. I stood there and watched the numbers roll. Sixty. Eighty. Ninety-something, and I’m quietly begging the thing to click.
It didn’t. $101.00.
Three digits on a gas pump. It hit me in the gut. So, I went home and did my background check, on the gas price and on me. On the radio I gave you the story. Here’s everything behind it: every number, every table, the research, and the places where my own theory fell apart.
1. The Fox graphic: accurate, and carefully chosen
The graphic that started this ran on Fox News under the banner “Dow Jones Market Data.” It counted the days crude oil sold for more than $100 a barrel under each of the last 4 Presidents.
I pulled the Energy Department’s daily spot price record and counted every trading day myself. Terms run from inauguration day to the day before the next inauguration. The current term is counted through September 15, 2026, the latest day in the daily record I used.
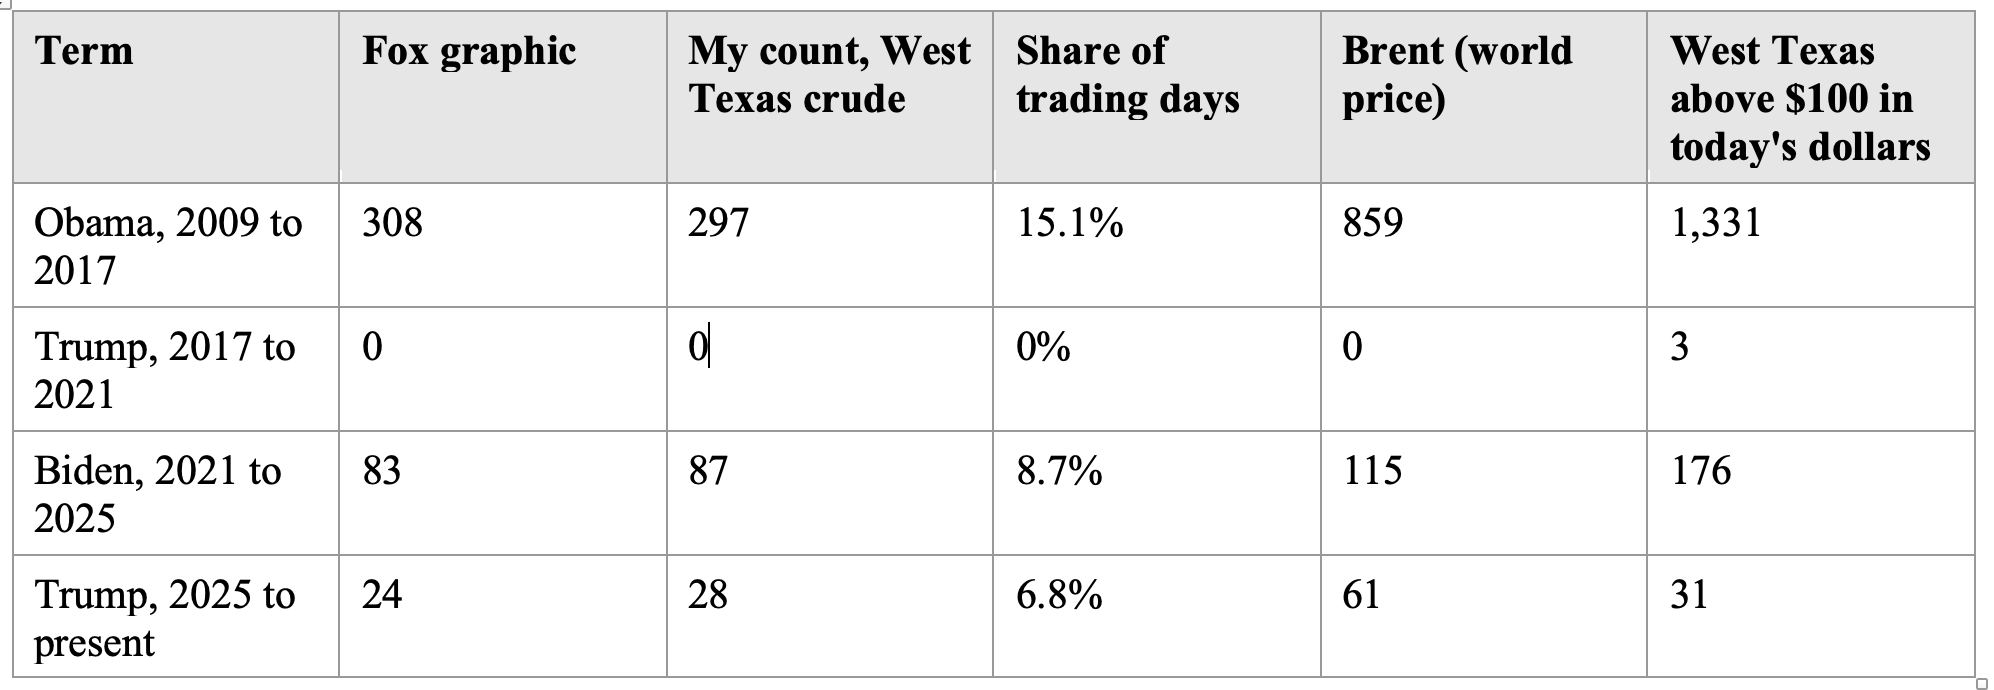
What checks out. The ranking holds, and the numbers are close. The small gaps most likely come from Dow Jones using futures settlement prices where I used the government’s spot price. That’s my inference; Fox didn’t publish its method. One clue: Fox’s “24” is exactly the spot count through September 9, which suggests the graphic was built around then. West Texas crude kept closing above $100 through at least September 15 before falling back into the low $90s this week.
What it leaves out. Three things, and they point in different directions.
• Which oil. West Texas Intermediate is the American benchmark. Brent is what most of the world pays, and what sets import prices on the coasts. Count Brent and the current term has 61 days above $100 after 20 months, more than half of Biden’s four-year total.
• Inflation. A $100 barrel in May 2011 is about $149 today. Count days above $100 in today’s money and the Obama number explodes to 1,331, about two-thirds of his presidency. That strengthens Fox’s point about the Obama years.
• Time. This term has more than two years to run, and the Strait of Hormuz is not settled. Comparing a partial term to full ones flatters whoever is still in office.
And one more, which is my opinion: presidents have limited control over crude oil. The Obama run came from the Arab Spring, the Libyan civil war and Chinese demand. The Biden run came from Russia’s invasion of Ukraine. The current run came from the war with Iran, which is the one episode on this list that followed directly from a presidential decision. The other side will make that point, and rightly so.
Every number on that screen was right. Somebody still picked which numbers to show you.
2. Gasoline under four presidents, in today’s dollars
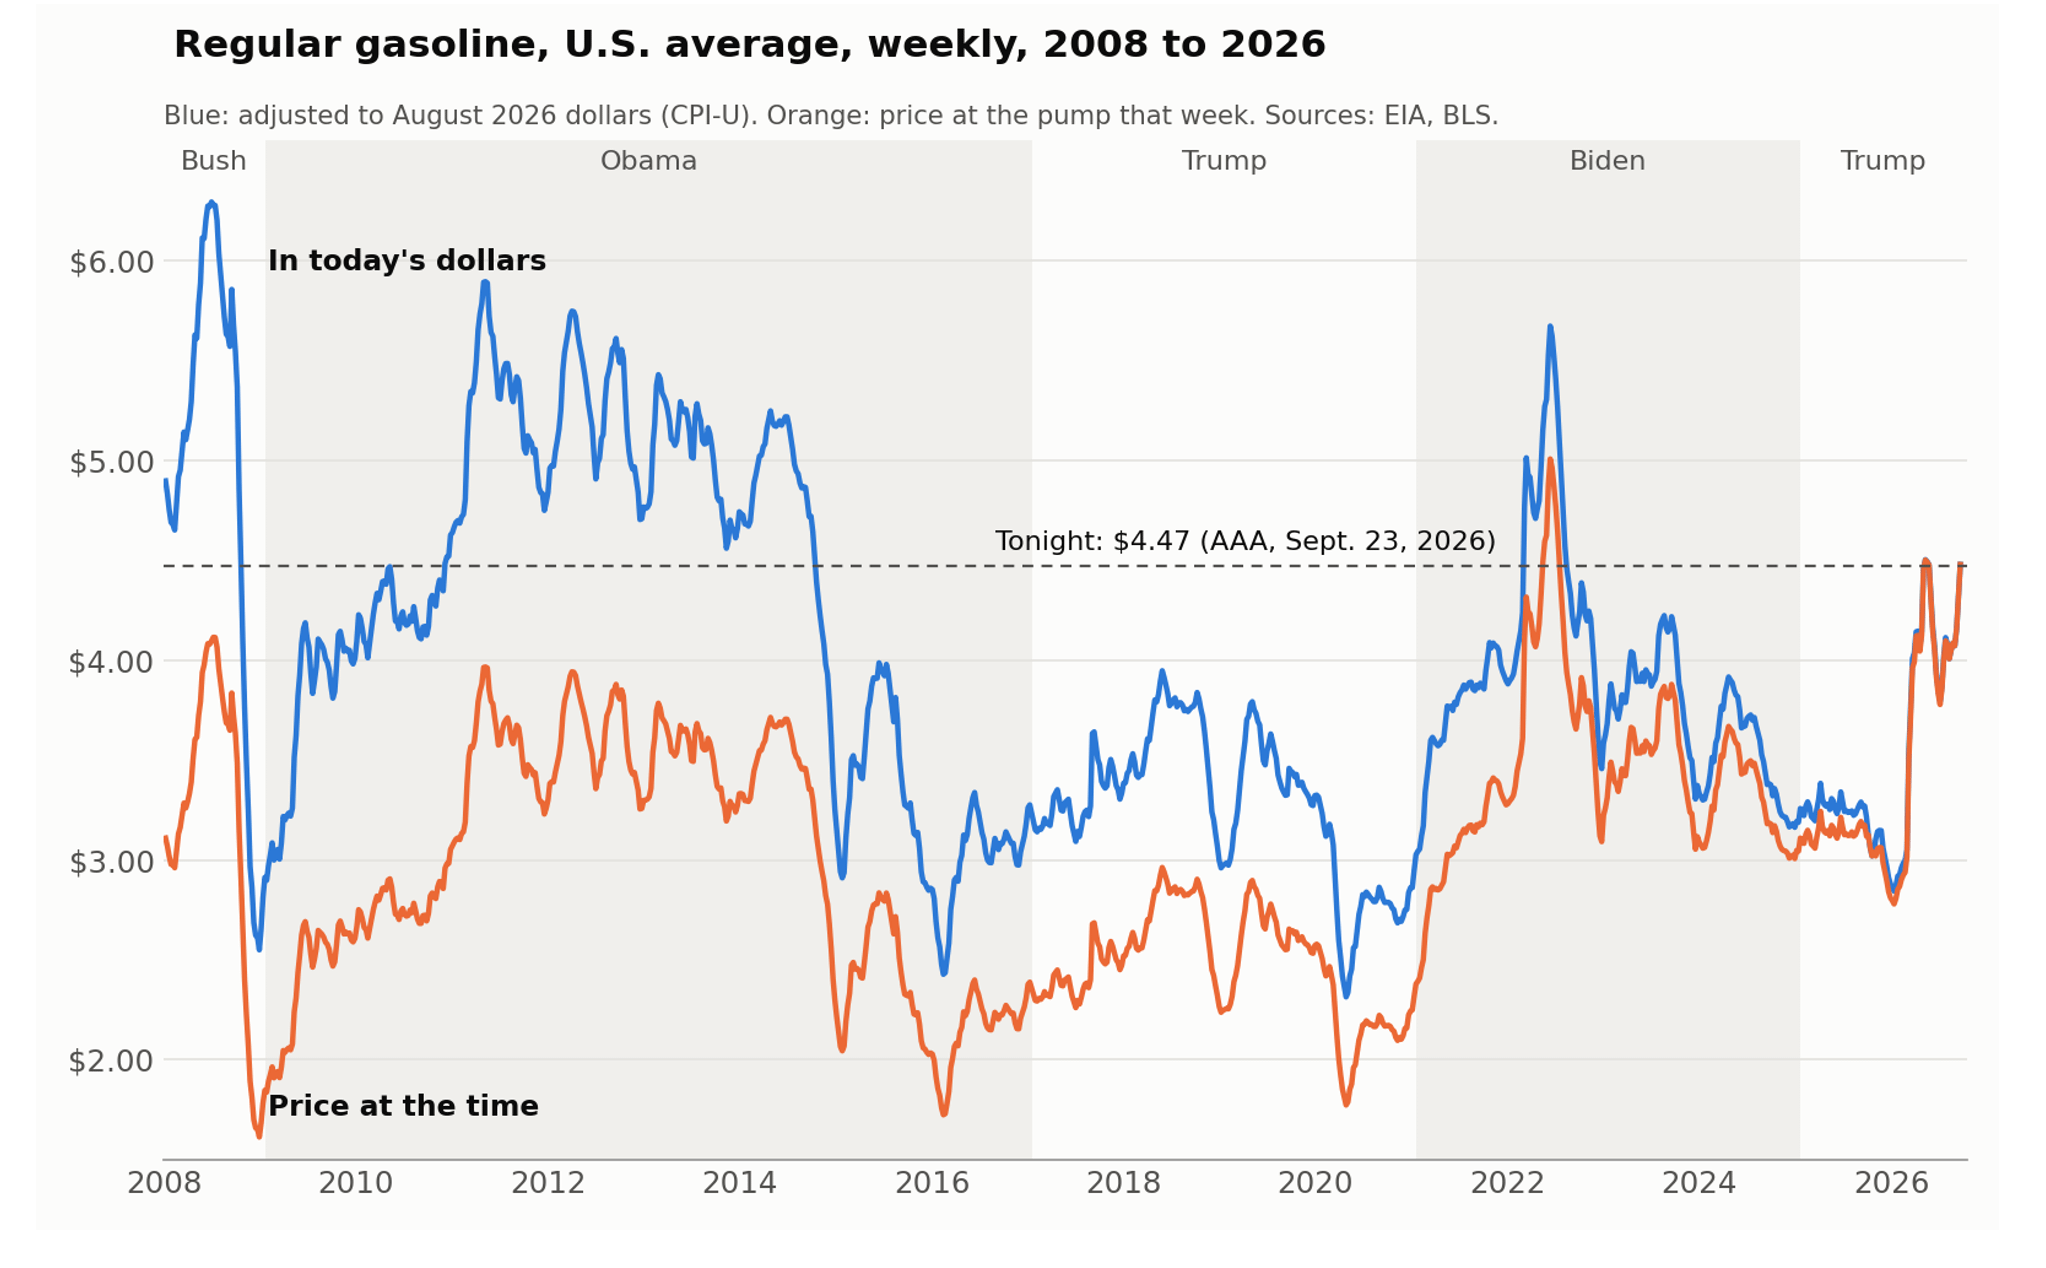
Here’s the gas-price version, using the Energy Information Administration’s weekly national average for regular and converting every week to August 2026 dollars with the Consumer Price Index.
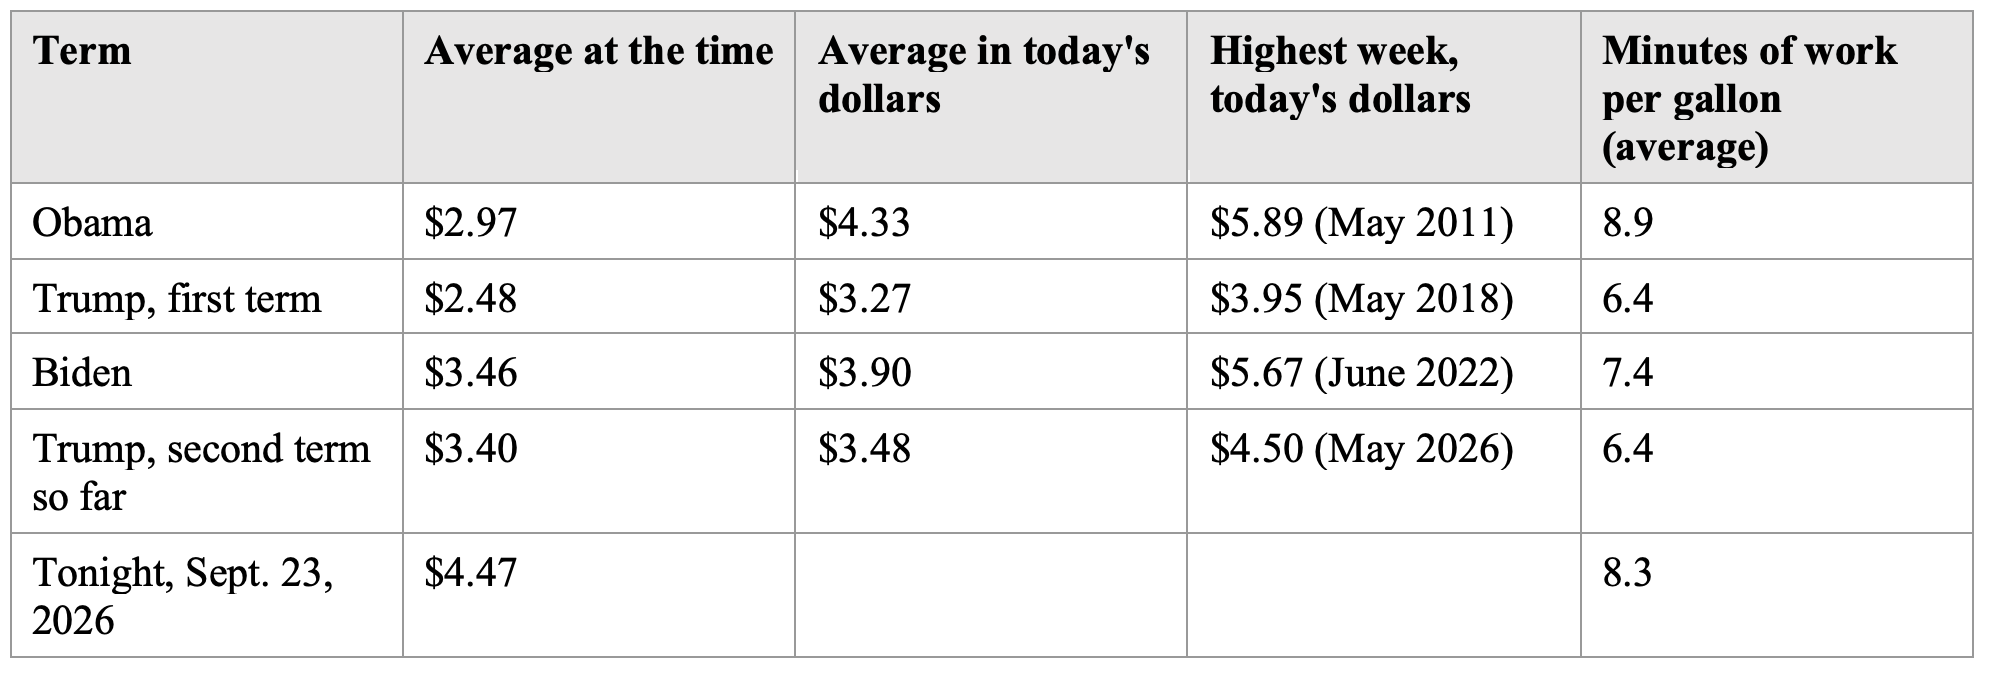
Minutes of work uses the Bureau of Labor Statistics average hourly earnings for production and nonsupervisory workers, the rank-and-file 80% or so of the private workforce. That wage is $32.53 an hour as of August.
Against Obama: tonight’s national average is about 14 cents, or 3 percent, above the Obama-era average in today’s dollars. The eight-year average hides how high the first term ran. In 202 of Obama’s 417 weeks, gas cost more in today’s dollars than it does tonight. Measured in work, tonight’s gallon takes 8.3 minutes, slightly less than the Obama average of 8.9. Wages have outrun gasoline since then.
Against the others: tonight is above the Trump first-term and Biden averages in today’s dollars and above every week of Trump’s first term. It sits within 3 cents of this term’s own high, set in May.
3. My $101, back through time
My receipt: $101.00 at $4.05, which works out to about 25 gallons. Sam’s Club runs cheaper than average, so for a fair comparison I priced the same 25 gallons at the national average in every year.
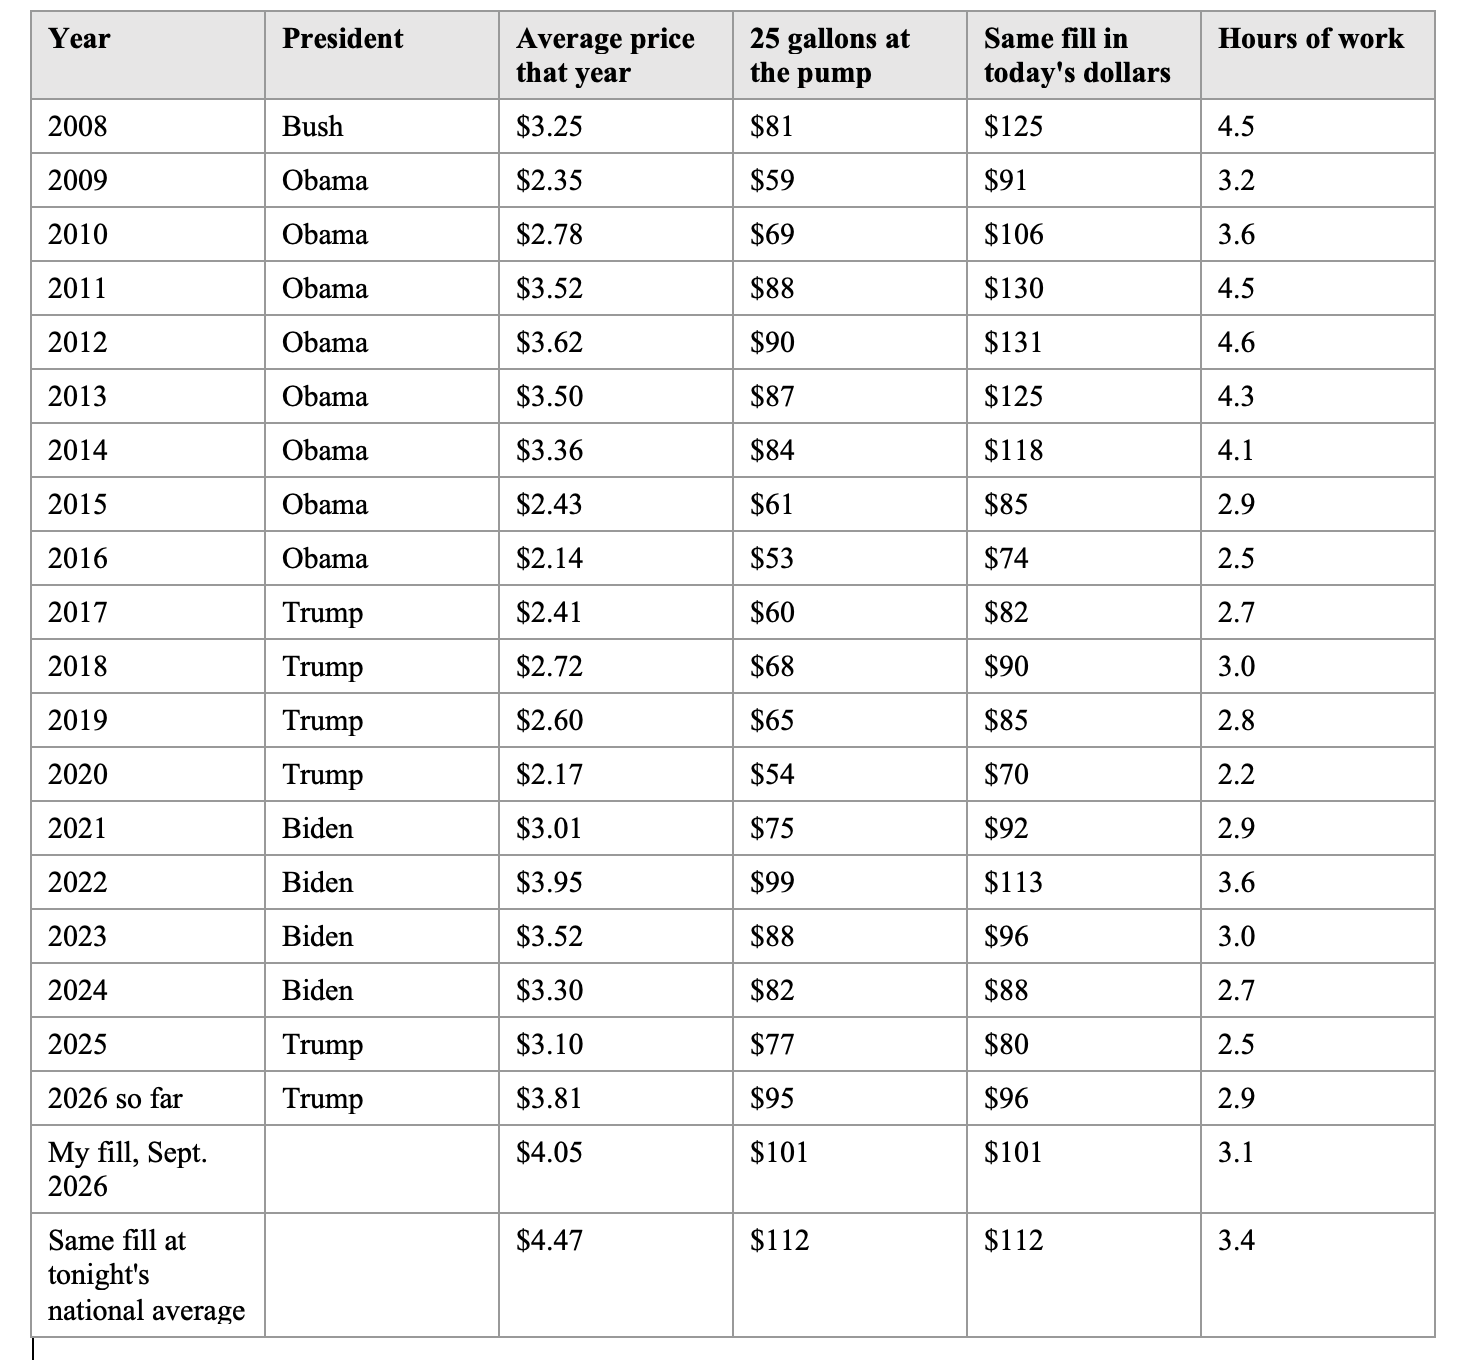
Three single weeks worth pulling out:
• July 7, 2008: $4.11 a gallon. My 25 gallons would have cost $102.60 at the pump, $157 in today’s dollars, and 5 hours 40 minutes of work. The triple-digit fill-up is not new. We forgot it.
• May 9, 2011: $3.96. That’s $98.88 at the pump, $147 in today’s dollars, 5.1 hours of work.
• June 13, 2022: $5.01, the all-time nominal record week. That’s $124.84 at the pump, $141 in today’s dollars, 4.5 hours of work.
My fill, as a national average, took 3 hours and 6 minutes of work.
4. How much of the household budget goes to the pump
The Bureau of Economic Analysis tracks what Americans spend on “gasoline and other energy goods” (mostly motor fuel, plus heating oil and propane) as a share of all consumer spending.
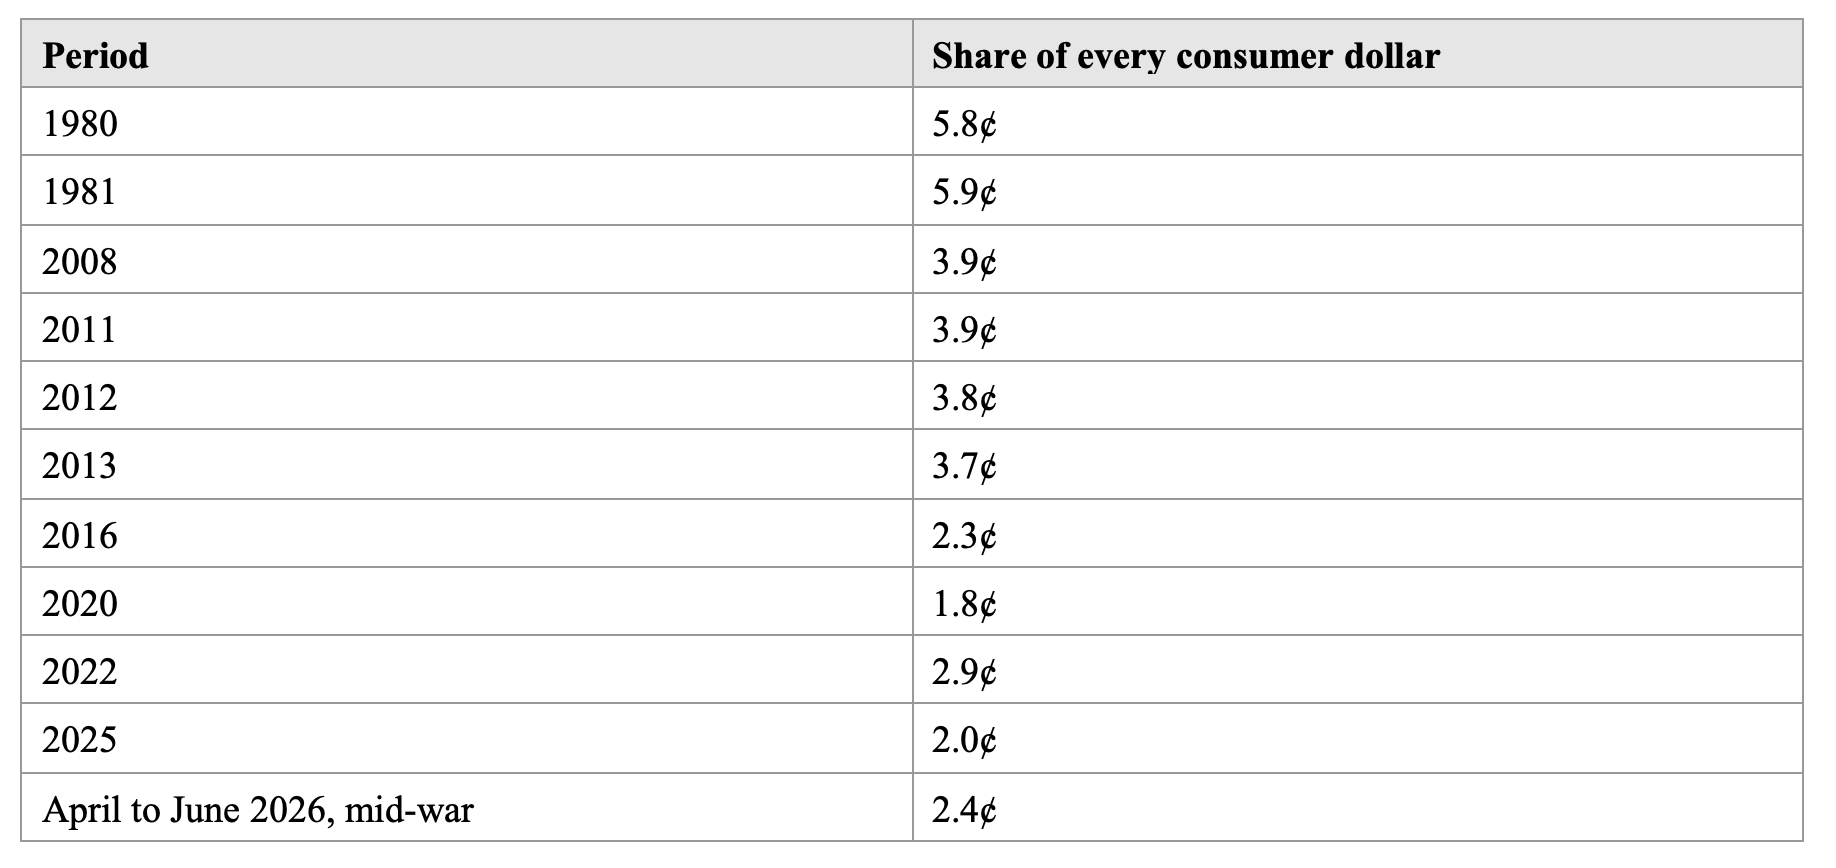
Even in the second quarter of this year, with a war on and oil over $100, fuel took a smaller bite of the household dollar than in any year from 2005 through 2014. The third-quarter figure will be higher once it posts, but it would have to rise by more than half to match 2012.
5. So why does it feel like a catastrophe?
If the math says “bad but not historic,” why did $101 turn my stomach? The research points to five things, and none of them is stupidity.
The sign. Few prices in your life are posted 20’ in the air on every busy corner, changed daily, in numbers you can read at 45 mph. You probably don’t know what a gallon of milk costs at King Soopers right now. But you know the gas price to the penny, because you drove past it at least 4 times today.
The meter. Scott Rick, a marketing professor at the University of Michigan, told Marketplace in 2022 that with gas, “you’re just there and watching this thing climb and climb.” The mortgage leaves by autopay and you never watch it happen. At the pump you hold the nozzle and watch every penny go.
How often you buy it. Economists Francesco D’Acunto, Ulrike Malmendier, Juan Ospina and Michael Weber matched households’ actual grocery purchases to what those same people believed inflation was (Journal of Political Economy, 2021). People weighted price changes by how often they bought an item, not by how much they spent on it, and price increases loomed larger than decreases of the same size. You buy gas every week, so it’s the loudest price you know. Federal Reserve researchers have documented the same pull for years. A Kansas City Fed analysis this February found the correlation between gas prices and household inflation expectations ran near 0.8 from 2015 to 2024. (That link broke in 2025, when tariffs became what people blamed for inflation.)
The digit. Akshay Rao of the University of Minnesota points out that nobody panics at $3.96, because $3.99 is still “three-something.” The left digit is what we read. In a February 2022 AAA survey, 59 percent of Americans said $4 gas would make them change how they drive or live; at $5 it was three in four.
Frozen memories. I can tell you gas was about $1.84 the week Barack Obama was sworn in. I can’t tell you what the average paycheck was that week. (It was $18.39 an hour for rank-and-file workers in January 2009. I looked it up.) We keep the old price in our heads and forget the old wage. Economists call that money illusion.
6. My theory, and where it broke
I went in believing the national media was pushing this: that newsrooms had decided four-dollar gas was the story and would beat the drum until November. So, I tested that too.
The best evidence is a study by Ryan Cummings, Giacomo Fraccaroli and Neale Mahoney, published May 6, 2024, in Briefing Book. They pulled 1.1 million TV transcripts, every show on ABC News, CBS News, NBC News, CNN, Fox News and MSNBC from March 2004 through December 2023, flagged any show that mentioned “gas prices” or “gasoline prices,” and scored the tone with language-analysis software.
A note on the source’s lean: Mahoney served as a special policy adviser on President Biden’s National Economic Council, and Briefing Book is run by economists who have advised the White House, Treasury and OMB. Read it with that in mind. The core of the study is transcript counts, and its most striking finding doesn’t flatter the networks usually friendly to Democrats either.
What they found:
• A nominal trigger. Below $3.50 a gallon, TV barely mentions gas. Above it, coverage climbs in a straight line: each 50-cent rise adds 7.5 percentage points. Only 2.7 percent of shows mention gas prices on average; 10.4 percent do at $4.00, and 18.2 percent at $4.50.
• The trigger never adjusted for inflation. In nominal terms it held steady ($3.45 for 2004 to 2009, $3.65 for 2010 to 2016, $3.55 for 2017 to 2023). In real terms it fell by almost a third, from $4.95 to $3.50 in late-2023 dollars. A decade ago the real price had to reach $4.75 before TV ramped up; by 2023 it took $3.50.
• Consistently negative. About 70 percent of gas-price transcripts scored negative, across years and across cable and broadcast.
• Cable far more than networks, Fox most of all. Above $3.50, each 50-cent rise raised cable coverage 19.0 points versus 4.2 for the broadcast networks. Fox’s response was almost 50 percent stronger than CNN’s or MSNBC’s. In the second week of June 2022, the week before the $5.02 record, 78.4 percent of Fox News programs mentioned gas prices, against 43.2 percent on CNN and 38.4 percent on MSNBC.
• No partisan switch. The authors found no significant change in coverage based on the party of the president. Price trends didn’t matter either. Once they controlled for the price level, how fast it had moved over the prior two weeks had no effect on coverage.
So, my theory holds up on amplification and fails on motive. The media does inflate the fear, with a trigger price frozen in time and a steady negative tone. But through 2023 the machine ran the same way no matter who was president, and the loudest outlet was Fox. That’s a business model. Bad news holds an audience, and the gas price produces a new piece of it every morning, posted on a sign.
Two caveats. The study ends in 2023, so it can’t tell us whether coverage behaves differently in 2025 and 2026. And Media Matters, a left-leaning media watchdog, has documented Fox figures this summer arguing that prices “could have been a lot higher.” That’s the same network that led the gas-price coverage in 2022. Whether the tone flips with the president is a question the data hasn’t answered yet. My inference, and it’s only that: Fox’s volume tracks the price, and its tone may track who’s in the White House.
7. The politicians taught us this
Both parties spent 20 years teaching voters that the president sets the price at the pump.
• 2012: Newt Gingrich built his campaign around “$2.50 gas.” In a March 2 campaign release, his “two-fifty plan” promised to slash gas prices through more drilling and the Keystone pipeline.
• 2012: President Obama mocked the idea, saying Republicans dust off plans for $2 gas every election cycle.
• 2022: President Biden branded the spike “Putin’s price hike.” The White House put it in the title of a fact sheet.
• February 24, 2026: In the State of the Union, President Trump said gas was “below $2.30 a gallon in most states and in some places, $1.99 a gallon.” Per AAA data reported by Forbes, the national average that week was about $2.98, and no state averaged below $2.30. The lowest was Oklahoma, at $2.40.
The evidence that voters punish presidents for gas prices is real but modest. Analyst G. Elliott Morris estimated this April that a 10 percent monthly jump in gas prices goes with about a one-point drop in net approval, with a stronger link for Obama and Biden than for Trump in either term. Politicians keep making pump promises anyway.
8. Where the pain is real
The other side’s case: “Easy for you to say. Relative doesn’t pay my bill.” Here’s that case at full strength.
• The speed. A year ago the national average was $3.17. Tonight it’s $4.47. That’s $1.30, or 41%, in twelve months. Budgets are built on last year’s prices, and no paycheck rose 41%. If yours did, congratulations. Mine did not.
• Colorado. AAA’s statewide average was $4.30 early this week, up $1.16 from a year ago, per CPR News. At 25 gallons a week, that’s $29 more every week, about $1,500 a year, after taxes.
• Geography. Across 13 Western Slope counties, regular ran $4.51 to $4.74. Pitkin County averaged $5.74. Rural drivers drive farther and have no transit to fall back on.
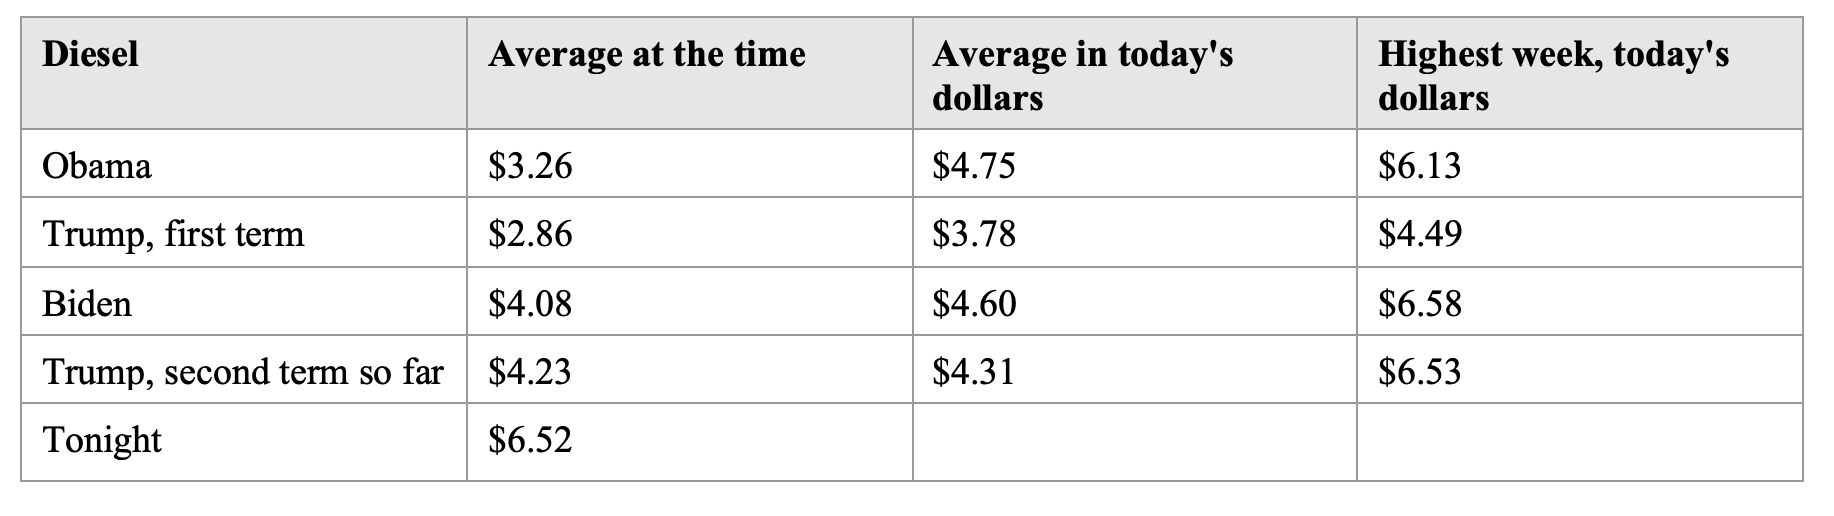
• Diesel. $6.52 national tonight, $6.13 in Colorado. In today’s dollars, diesel is higher than any week of Obama’s eight years (his inflation-adjusted peak was $6.13) and any week of Trump’s first term. Only Biden’s worst week, June 2022, was higher, at $6.58, six cents above tonight. Diesel moves the groceries. The truckers who text me aren’t exaggerating.
All of that is real, and a newsroom didn’t invent any of it. But read that case closely. It’s about how fast the price jumped, about diesel, and about where you live. The digit 4 isn’t in it anywhere. If $4 gas were a catastrophe on its own, America lived through a three-year catastrophe in 2011, 2012 and 2013, at higher real prices than tonight, and most of us paid it and went to work.
9. Why it matters
Panic is a sales opportunity. When enough people believe $4 is the end of the world, somebody in Washington arrives with a fix: a gas-tax holiday, a diesel export ban, a windfall profits tax, a price-gouging law. I took those apart earlier this week in The Diesel Fix That Raises Your Price (link to add). Each one moves the pain onto a different American or shrinks the supply that ends it. All of them are sold to people frightened by a number on a sign.
So, here’s my one piece of homework. Next time the pump rolls past $100, divide the total by what you earn in an hour. Mine came to 3 hours and 6 minutes based on the national averages. In 2012 the same tank took 4.6 hours; in the summer of 2008, 5 hours and 40 minutes.
Then ask who is selling you the panic, and what they plan to sell you next.
Tell me in the comments: what did you pay, how many gallons, and how many hours of work was it? And if you think I’ve got this wrong, explain why.
Sourcing and verification
Prices and data (all accessed September 23, 2026)
• AAA national average (regular $4.474; diesel $6.522; year-ago regular $3.172): gasprices.aaa.com
• Weekly retail regular and diesel, 1990 to Sept. 21, 2026: U.S. Energy Information Administration, series GASREGW and GASDESW, via FRED (St. Louis Fed)
• Daily crude spot prices, WTI Cushing and Brent: EIA series RWTC and RBRTE, via the datasets/oil-prices mirror on GitHub (data through Sept. 15, 2026). Current WTI (~$91 to $92): Trading Economics
• Inflation: BLS Consumer Price Index, CPI-U, seasonally adjusted (CPIAUCSL), August 2026 = 334.131
• Wages: BLS average hourly earnings of production and nonsupervisory employees, total private (AHETPI), August 2026 = $32.53
• Spending share: BEA personal consumption expenditures on gasoline and other energy goods (annual DGOERC1A027NBEA; quarterly DGOERC1Q027SBEA) divided by total PCE
• Colorado prices: CPR News, “Coloradans are feeling pain at the pump. Some more than others,” Sept. 22, 2026, citing AAA
Method notes
• Presidential terms: Jan. 20 through Jan. 19 of the year the successor took office. Current term through the latest data point.
• “Today’s dollars” = August 2026 CPI-U; each week uses its month’s CPI.
• Fill-up comparisons use 24.94 gallons ($101 ÷ $4.05) at the national average for each period.
• Oil-day counts are closing spot prices strictly above $100.00. Fox’s figures are labeled “Dow Jones Market Data”; its method isn’t published, and the explanation for the small differences is my inference.
• My inflation-adjusted count of 1,331 Obama-era days matches an independent count published by the Crisis Investing newsletter on Sept. 21, 2026.
Research
• Cummings, Fraccaroli and Mahoney, “Bad news bias in gasoline price coverage,” Briefing Book, May 6, 2024 (authors’ lean noted above)
• D’Acunto, Malmendier, Ospina and Weber, “Exposure to Grocery Prices and Inflation Expectations,” Journal of Political Economy 129(5), 2021
• Jason P. Brown, “A Break in the Link Between Gasoline Prices and Inflation Expectations,” Federal Reserve Bank of Kansas City, Feb. 20, 2026
• Marketplace, “Why is $4 a psychological tipping point for gasoline prices?” March 30, 2022 (Rao, Rick, Gauri)
• AAA, “$4 Gas the Tipping Point for Most Americans,” March 10, 2022 (survey Feb. 18 to 21, 2022; n = 1,051)
• G. Elliott Morris, gas prices and presidential approval analysis, April 10, 2026
Political record
• Gingrich “$2.50 plan”: campaign press release, March 2, 2012, American Presidency Project (UC Santa Barbara)
• Obama on “$2 gas” plans: NBC News, March 15, 2012 (paraphrased here)
• Biden “Putin’s price hike”: CNN, March 9, 2022; White House fact sheet, March 31, 2022
• Trump State of the Union quote and state price data: Forbes, Feb. 25, 2026
• Fox coverage this summer: Media Matters for America, September 2026 (left-leaning; cited for the quotations it documents)
Open items
• The TV-coverage study ends in 2023. Nothing yet measures 2025 to 2026 coverage by network.
• The third-quarter 2026 spending share hasn’t been published.
• Colorado county figures come from CPR’s reporting of AAA data. I could not pull AAA’s Colorado page directly.
• The “me” in this story, wages, hours worked, etc., is based on a national average, not my actual salary. But nice try in guessing what that might be. See, I know my audience!
Interesting analysis. Here’s what I think it misses: before Trump started his 4 week war with Iran, gas prices were $2.something. Trump promised $2.something gas. Then his 4 week war dragged on, and Iran used its control of the Strait to create shortages. How could “the smartest and greatest president ever” not have anticipated that?
If Trump had prosecuted the war with an intent to win quickly, gas prices would be lower now. Sure, the Russia-Ukraine war aggravates the problem, but it’s been doing that since the Biden days. And Trump promised to end that war quickly.
And here’s the bigger problem - why should we be satisfied with what we have, just because it’s not as bad as what we had in the past? The whole point of capitalism is that it increases the standard of living for everyone, that it brings prices down as quality goes up, that competition means we don’t settle for shortages.
Wichita Falls TX 25 gallons @ $3.859. Total $96.48. Retired Army.